Insert Charts and Graphs into PowerPoint
Modified:
04/14/2020
|
Software Use and Troubleshooting
|
#51189
Categories
Microsoft Office
>
PowerPoint
|
Insert Charts and Graphs into PowerPoint
Question:
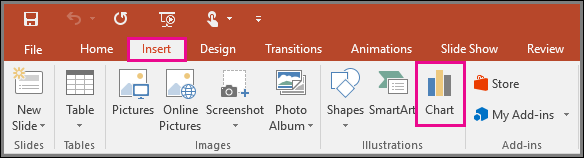
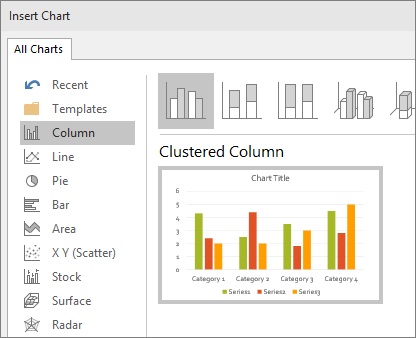
How do I create a chart or graph in PowerPoint?
Answer:
To create a simple chart or graph from scratch in PowerPoint, perform the following:
Additional Information:
For
additional information, please see the related link(s).
We welcome and appreciate your feedback!
Privacy Policy |
Website Terms and Conditions |
University of Phoenix Trademark Usage
Copyright © 2018 University of Phoenix |

Subscribe
Enter your email address to receive a notification when the article is updated
Email Address