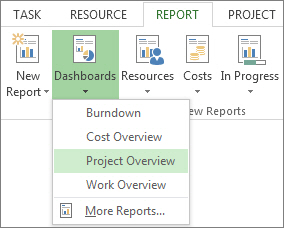
To create a report from a standard template in Microsoft Project, follow these steps:
- Click the Report tab.
- In the View Reports group, click the type of report you want and then pick a specific report.
- For example, to open the Project Overview report, click Report > Dashboards > Project Overview.

To create a custom report, follow these steps:
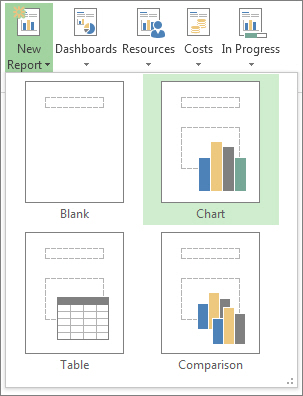
- Click Report > New Report.
- Pick one of the four options, and then click Select.
- Give the report a name and start adding information to it.

Blank Creates a blank canvas. Use the Report Tools Design tab to add charts, tables, text, and images.
Chart Project creates a chart comparing Actual Work, Remaining Work, and Work by default. Use theField List pane to pick different fields to compare, and use the controls to change the color and format of the chart.
Table Use the Field List pane to choose what fields to display in the table (Name, Start, Finish, and % Complete appear by default). The Outline level box lets you select how many levels in the project outline the table should show. You can change the look of the table on the Table Tools Design and Table Tools Layout tabs.
Comparison Sets two charts side-by-side. The charts have the same data at first. Click one chart and pick the data you want in the Field List pane to begin differentiating them.


